Data Visualization Alternatives for Windows
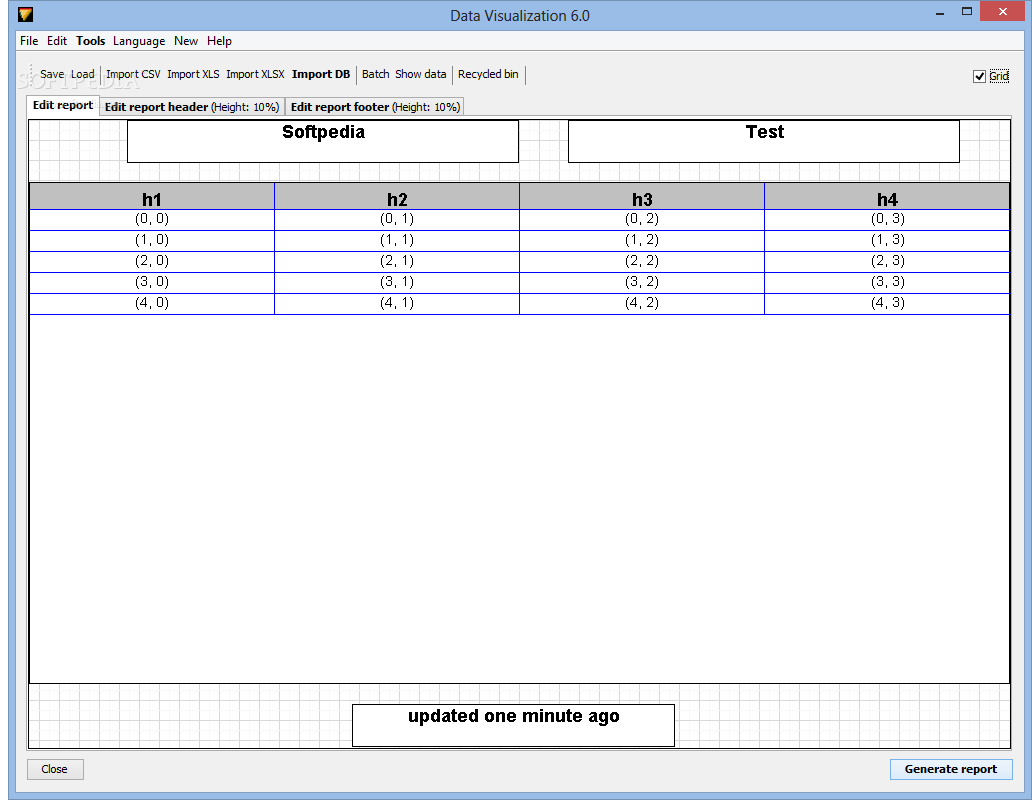
Do you want to find the best Data Visualization alternatives for Windows? We have listed 19 Office Tools that are similar to Data Visualization. Pick one from this list to be your new Data Visualization app on your computers. These apps are ranked by their popularity, so you can use any of the top alternatives to Data Visualization on your computers.
Top 19 Software Like Data Visualization - Best Picks for 2026
The best free and paid Data Visualization alternatives for windows according to actual users and industry experts. Choose one from 19 similar apps like Data Visualization 2026.
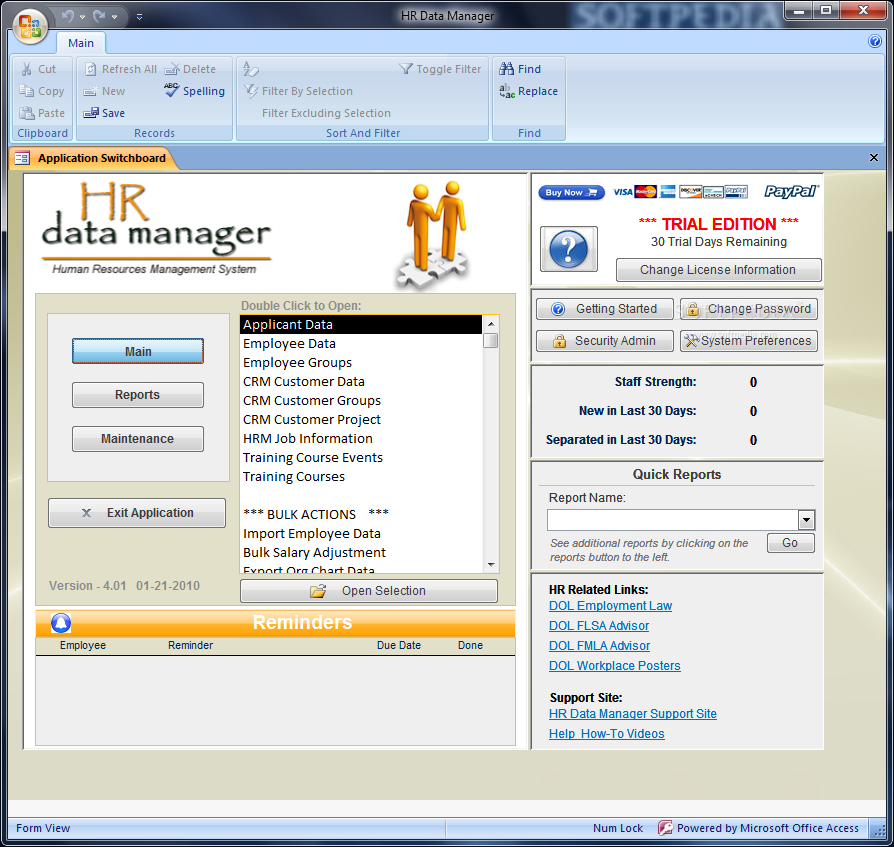
HR Data Manager
HR software solution for small and medium businesses, it allows you to manage your employees, track attendance, issue performance reviews and employee evaluationsThere are many applications on the Internet that you could use in order to manage your business....
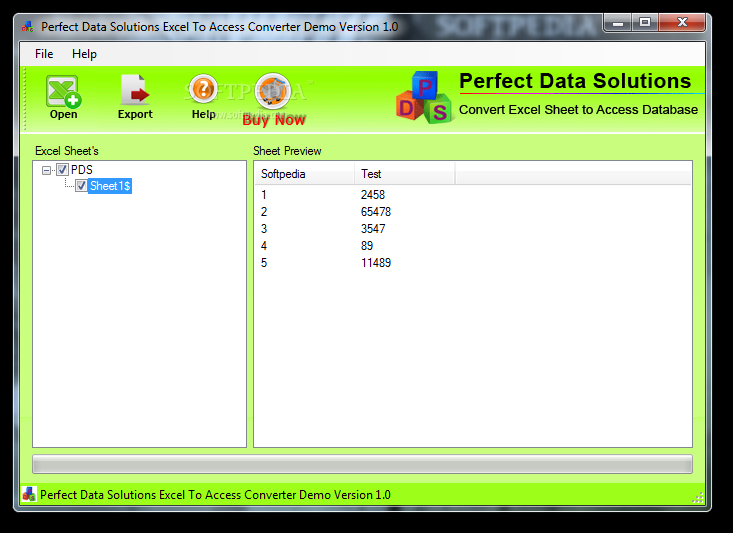
Perfect Data Solutions Excel to Access Converter
Easily transform XLS filesPerfect Data Solutions Excel to Access Converter is an application designed to assist users in exporting XLS sheets to Microsoft Access.In order to perform the conversion, you are simply required to browse for the Excel file...
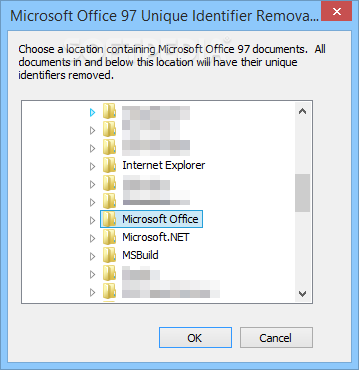
Office 2003/XP Add-in: Remove Hidden Data
Permanently remove hidden data and collaboration data, such as change tracking and comments, from Word, Excel and PowerPoint filesOffice 2003/XP Add-in: Remove Hidden Data is a lightweight add-in designed to lend you a hand with cleaning personal and hidden...
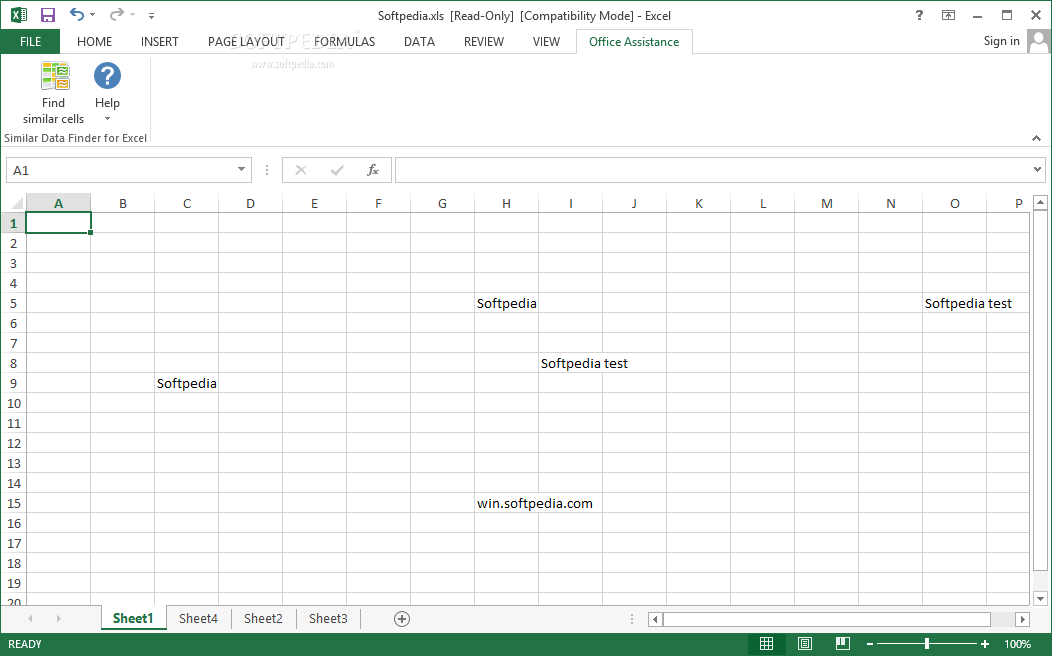
Similar Data Finder for Excel
A fast add-on application for Excel that helps you find similar cell values with ease, displaying the most relevant search resultsSearching for misspelled words in Excel worksheets can be eye exhausting, as you might easily lose sight of cells...
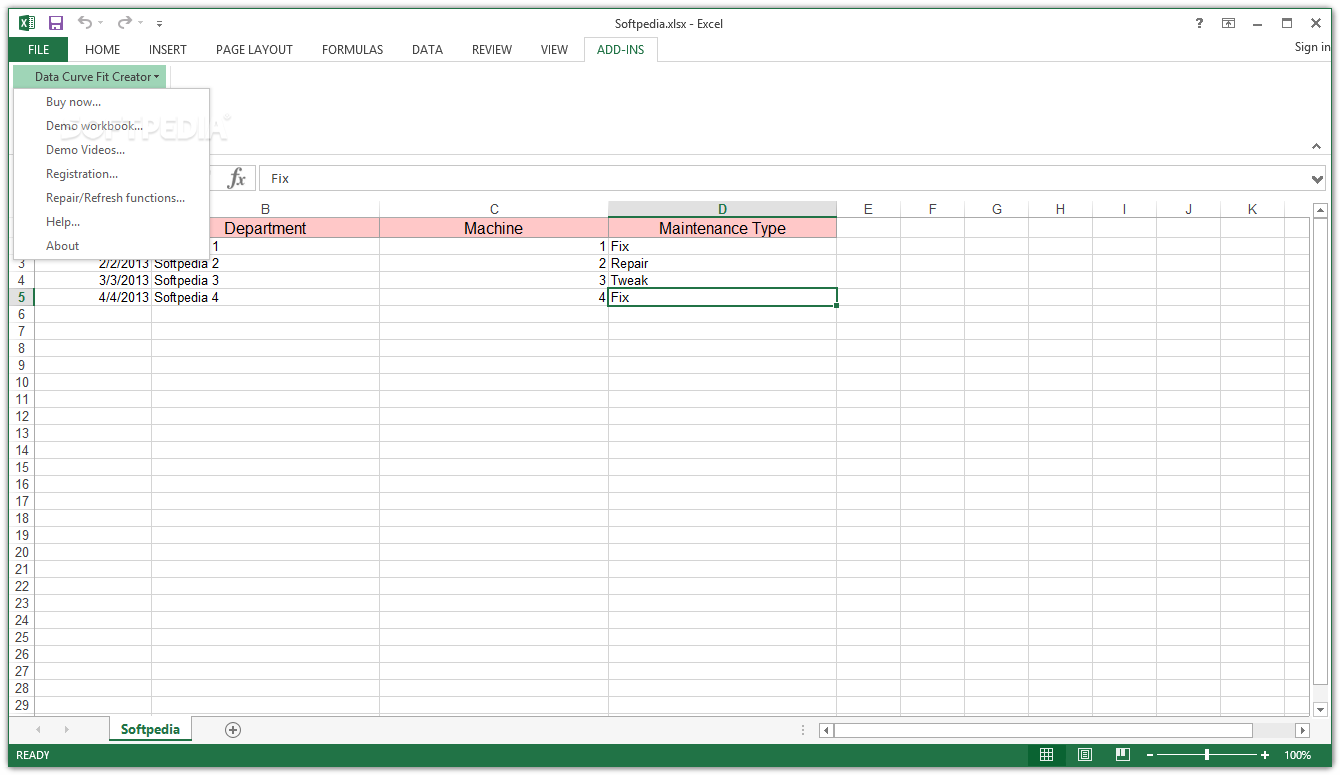
Data Curve Fit Creator Add-in
An easy-to-use data analysis add-in for Microsoft Excel that can be of assistance for curve fitting, interpolation and data smoothing What's new in Data Curve Fit Creator Add-in 2.71: Fixes, improvements - Various minor fixes and improvements were impelemented...
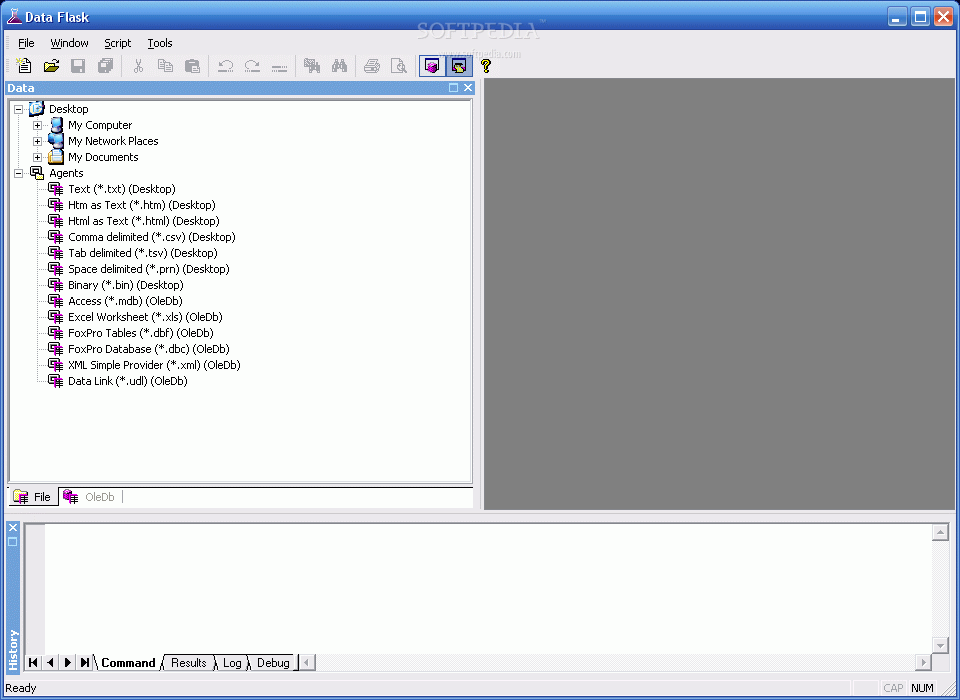
Data Flask
Data Flask is a spreadsheet application designed to retain data type, source, and key information.Data Flask is a Spreadsheet application created to retain data type, source, and key information. Migrate tables and indexes, changing only the connection string. Highly...
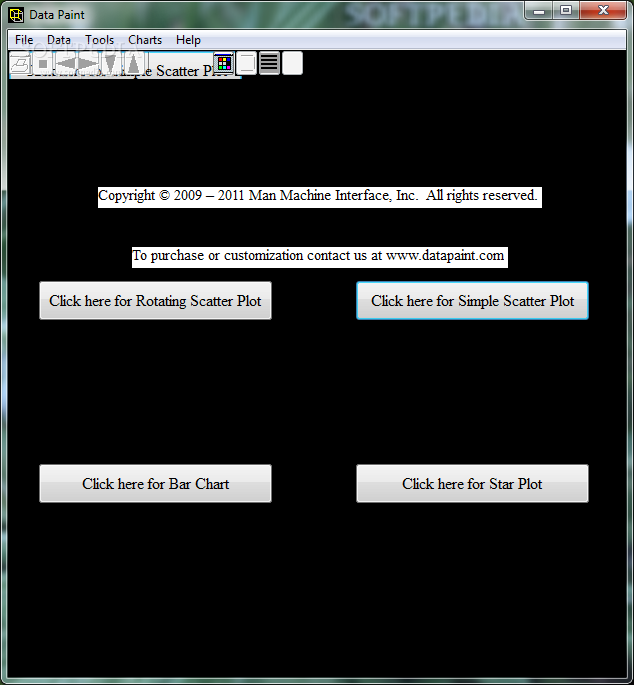
Data Paint
Paint the data in charts and graphs visually and numericallyData Paint allows the user to load files from comma delimited file (CSV), rotate data in three dimensional space, group and identify data interactively as well as viewing statistical information for...
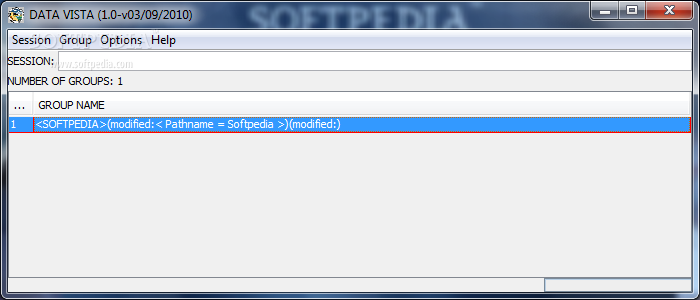
Data Vista
Data manipulation made easy.Data Vista is an easy to use tool designed to offer you a data retrieval, management, manipulation and visualization. The overall philosophy is to give a tool to access, manipulate and visualize data with ease.A graphical...
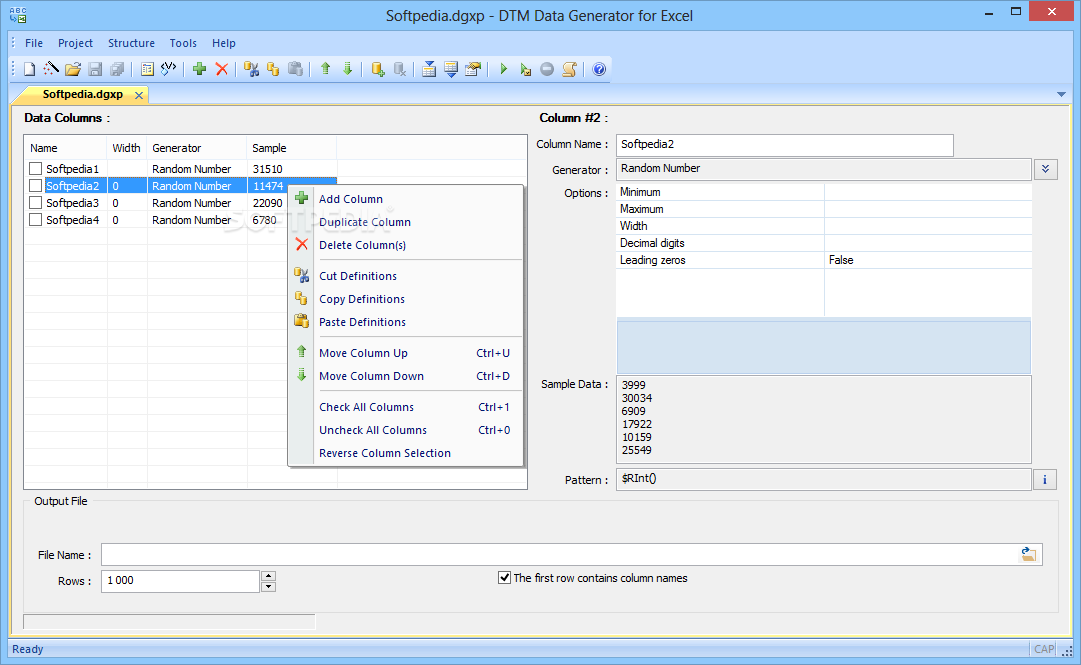
DTM Data Generator for Excel
Create Excel workbooks intended for testing operations, in a custom structure, by using this efficient and reliable software solutionDTM Data Generator for Excel is a user-friendly and straightforward piece of software developed to offer Quality Assurance engineers, programmers and...

Microsoft Office Visio 2007 Professional Add-In for Rack Server Virtualization
This amazing Add-in from Microsoft Office Visio 2007 Professional helps you plan virtualization.The Microsoft Office Visio 2007 Professional Add-In for Rack Server Virtualization helps you plan virtualization.With over 70% hardware being under-utilized, this very valuable tool can draw a...
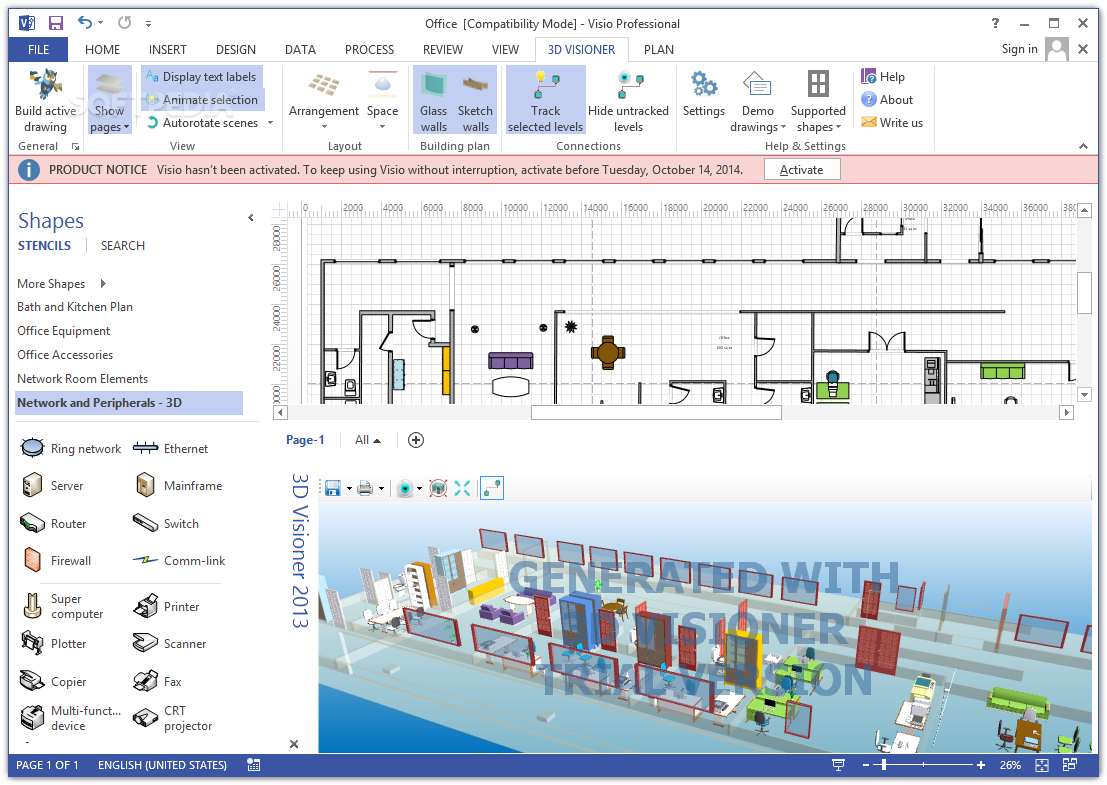
3D Visioner
Enhance your Microsoft Visio projects with the help of this add-in, which can easily render building plans and diagrams in 3D mode What's new in 3D Visioner 2014 2.95.00.0001: New supported shapes — we introduce more 3D models for...
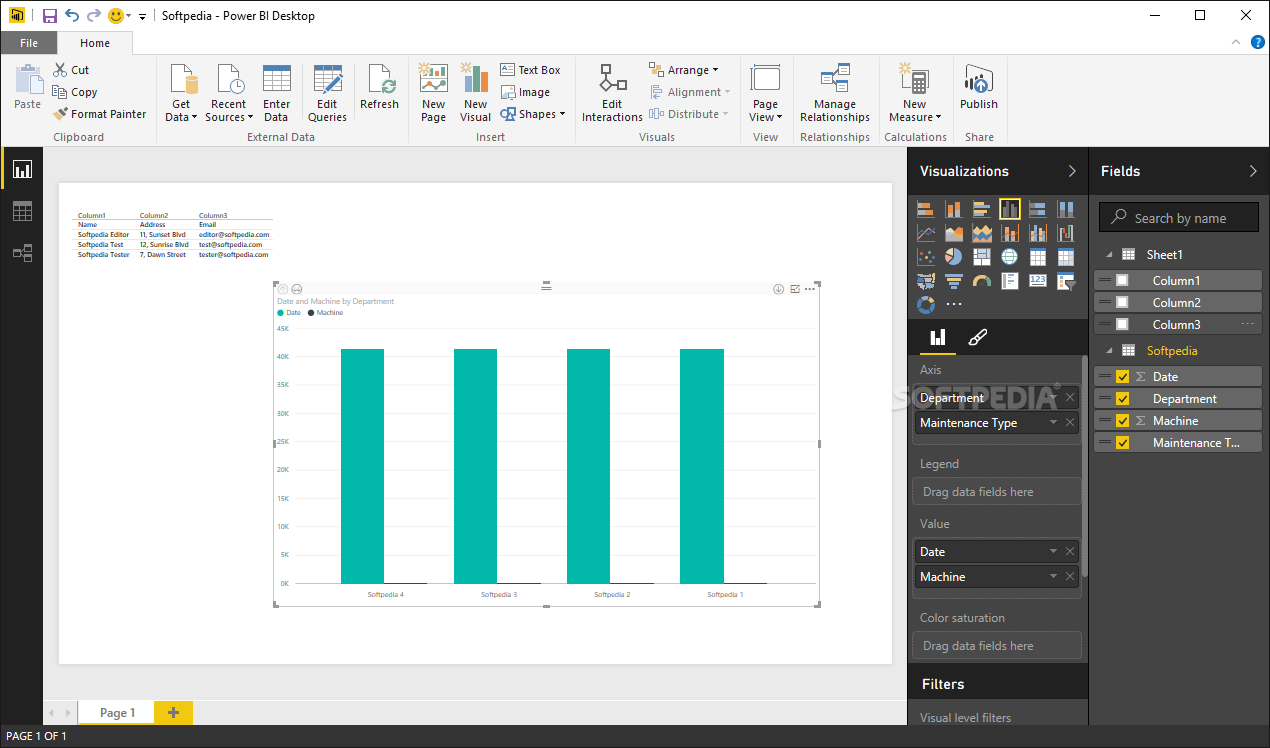
Microsoft Power BI Desktop
Visualize simple to complex sets of data, organize them and generate professional-looking reports that can be shared via the Power BI platformMicrosoft Power BI Desktop is a powerful data analytics and reporting tool designed as a companion desktop application...

Chart Tamer
Aligns Excel’s charts with the best practices of data visualizationChart Tamer attempts to align Excel’s charts with the best practices of data visualization, as taught in the book Show Me the Numbers by Stephen Few of Perceptual Edge. ...
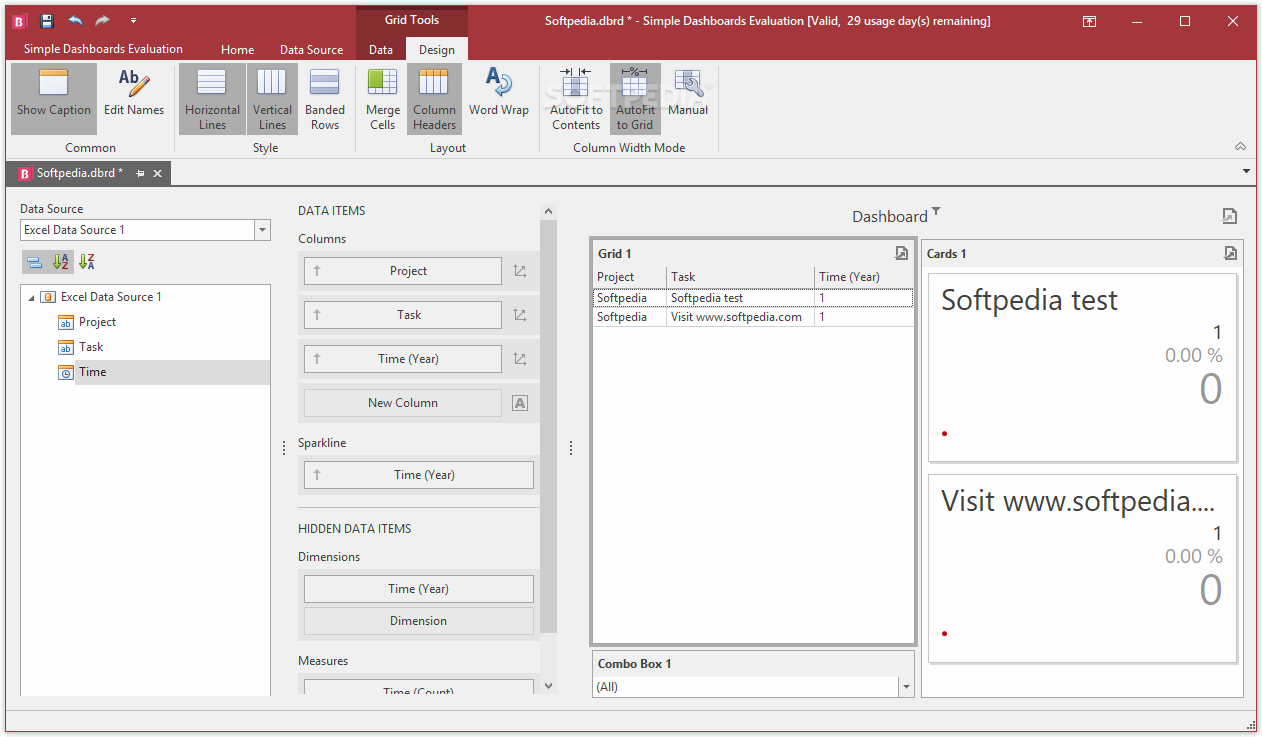
Simple Dashboards
Build neat dashboards using values from your database or local CSV and XLS files using various items like pivot, charts, cards, geo point maps, and moreYou can store large quantities of data in spreadsheets, and work with advanced expressions...

TreeMap
An interactive visualization software that allows seeing both the big picture and the details of your data instantly, detecting where large files are located IMPORTANT NOTICE What's new in TreeMap 2019.4.1: Forbes Global 2000 - 2020 dataset Improved...
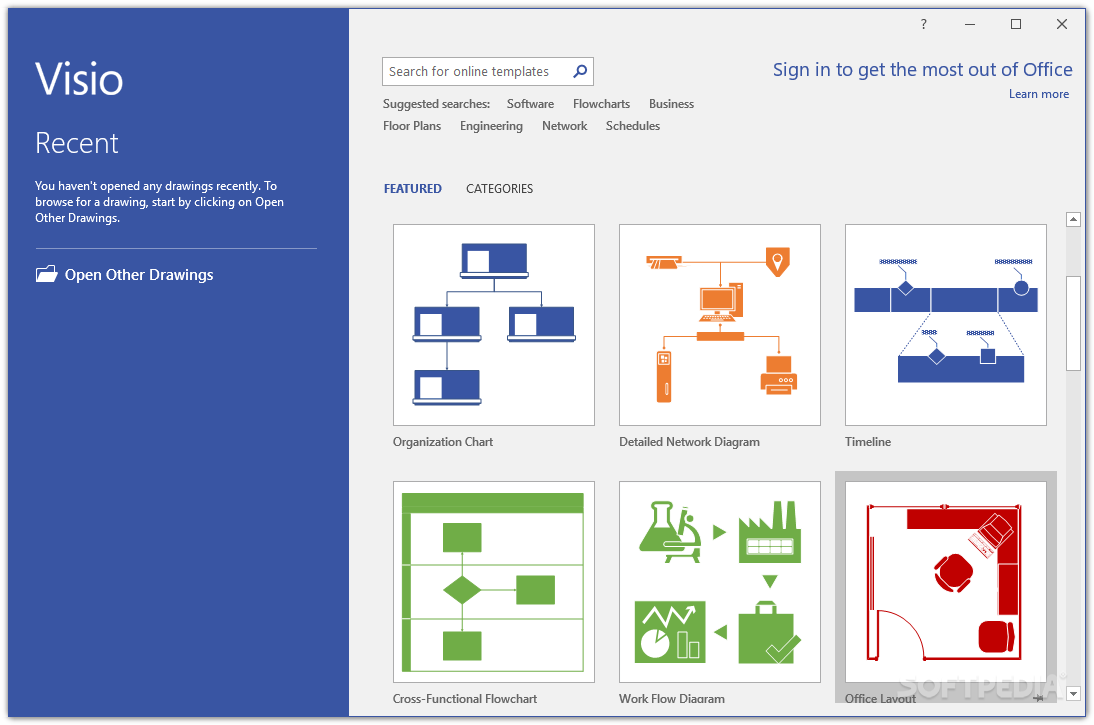
Microsoft Visio Professional
Takes diagramming to a new level, providing users with professional visualization tools and a rich set of templates they can start with to visually represent dataStanding up to its developer’s name, Microsoft Visio Professional is one of the industry-leading...
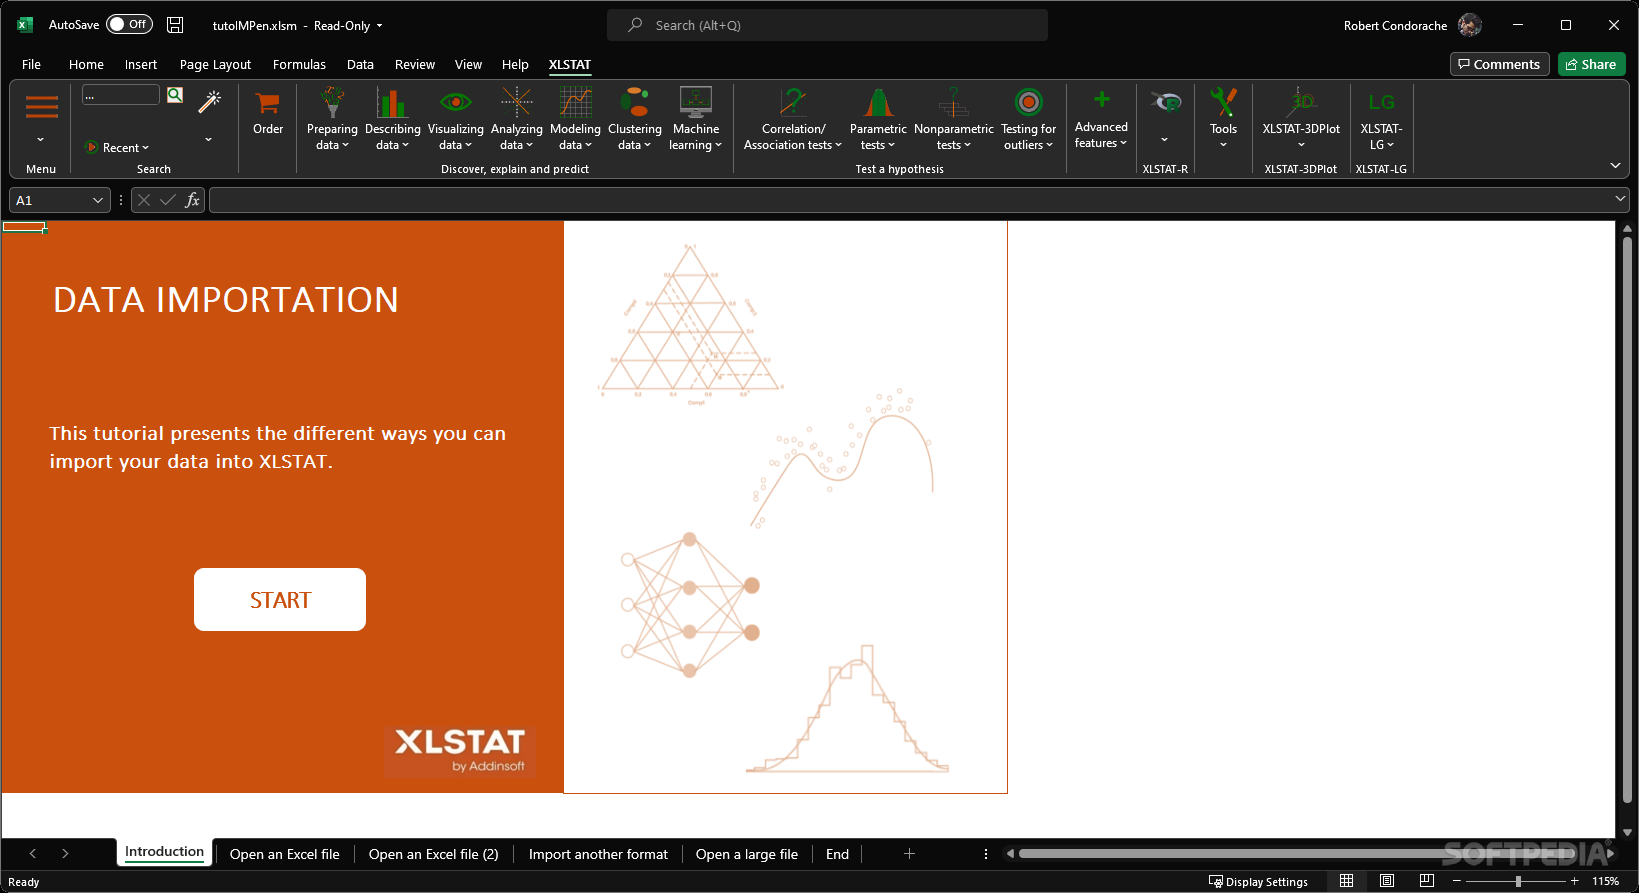
XLStat
A simple and efficient software utility that function as an Excel add-in, meant to help you perform various data manipulation operationsXLStatis an add-on that enhances the functionality of Microsoft Excel by adding advanced statistical analysis tools and a plethora...
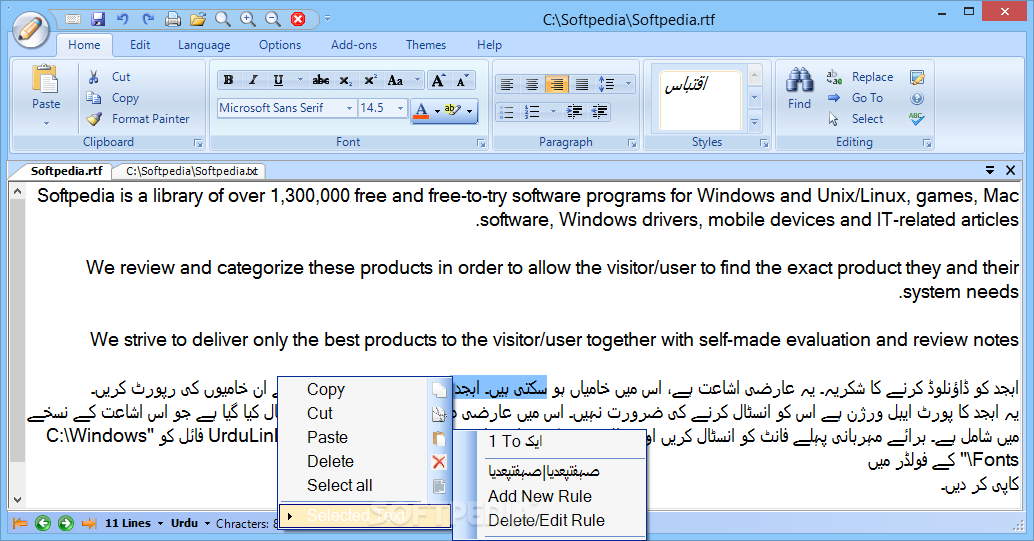
Abjad
Write and edit text in Urdu, Arabic, Pashto, Sindhi, Persian, Hindi and English, with this easy-to-use tool, that offers many useful featuresVarious text editing applications are available aside from the commonly used office tools. Abjad is one of them...